Soils Data
As one of the mainstays of the Surety® and Surety® Pro mapping systems, the soils maps are an excellent resource for all trades that require the value determination of the value of a particular piece of tillable land, gathering soil information for managing cropland/rangeland, or even researching potential building site subsoil features. Soil Maps provide up-to-date data for the Continental U.S. Generally, the soils data is updated in late fall of every year. The Surety and Surety Pro Soil Maps are unique in that they allow for the inclusion of many different types of data all on one map. Access the CSR and CSR2 for Iowa, Bulletin 811 for Illinois, NCCPI for the continental US, Soil Features and classifications, and the Productivity Index for North Dakota, South Dakota, and Minnesota. In addition to the most recent soil data, archived soil data is also available on every soil map generated within the system.
When you look at the information below you will find that the algorithms used to measure the probability of soil performance can be different from one state to another. The NCCPI, which is mentioned below, is an indicator that we could see that adopted and applied throughout the U.S. one day.
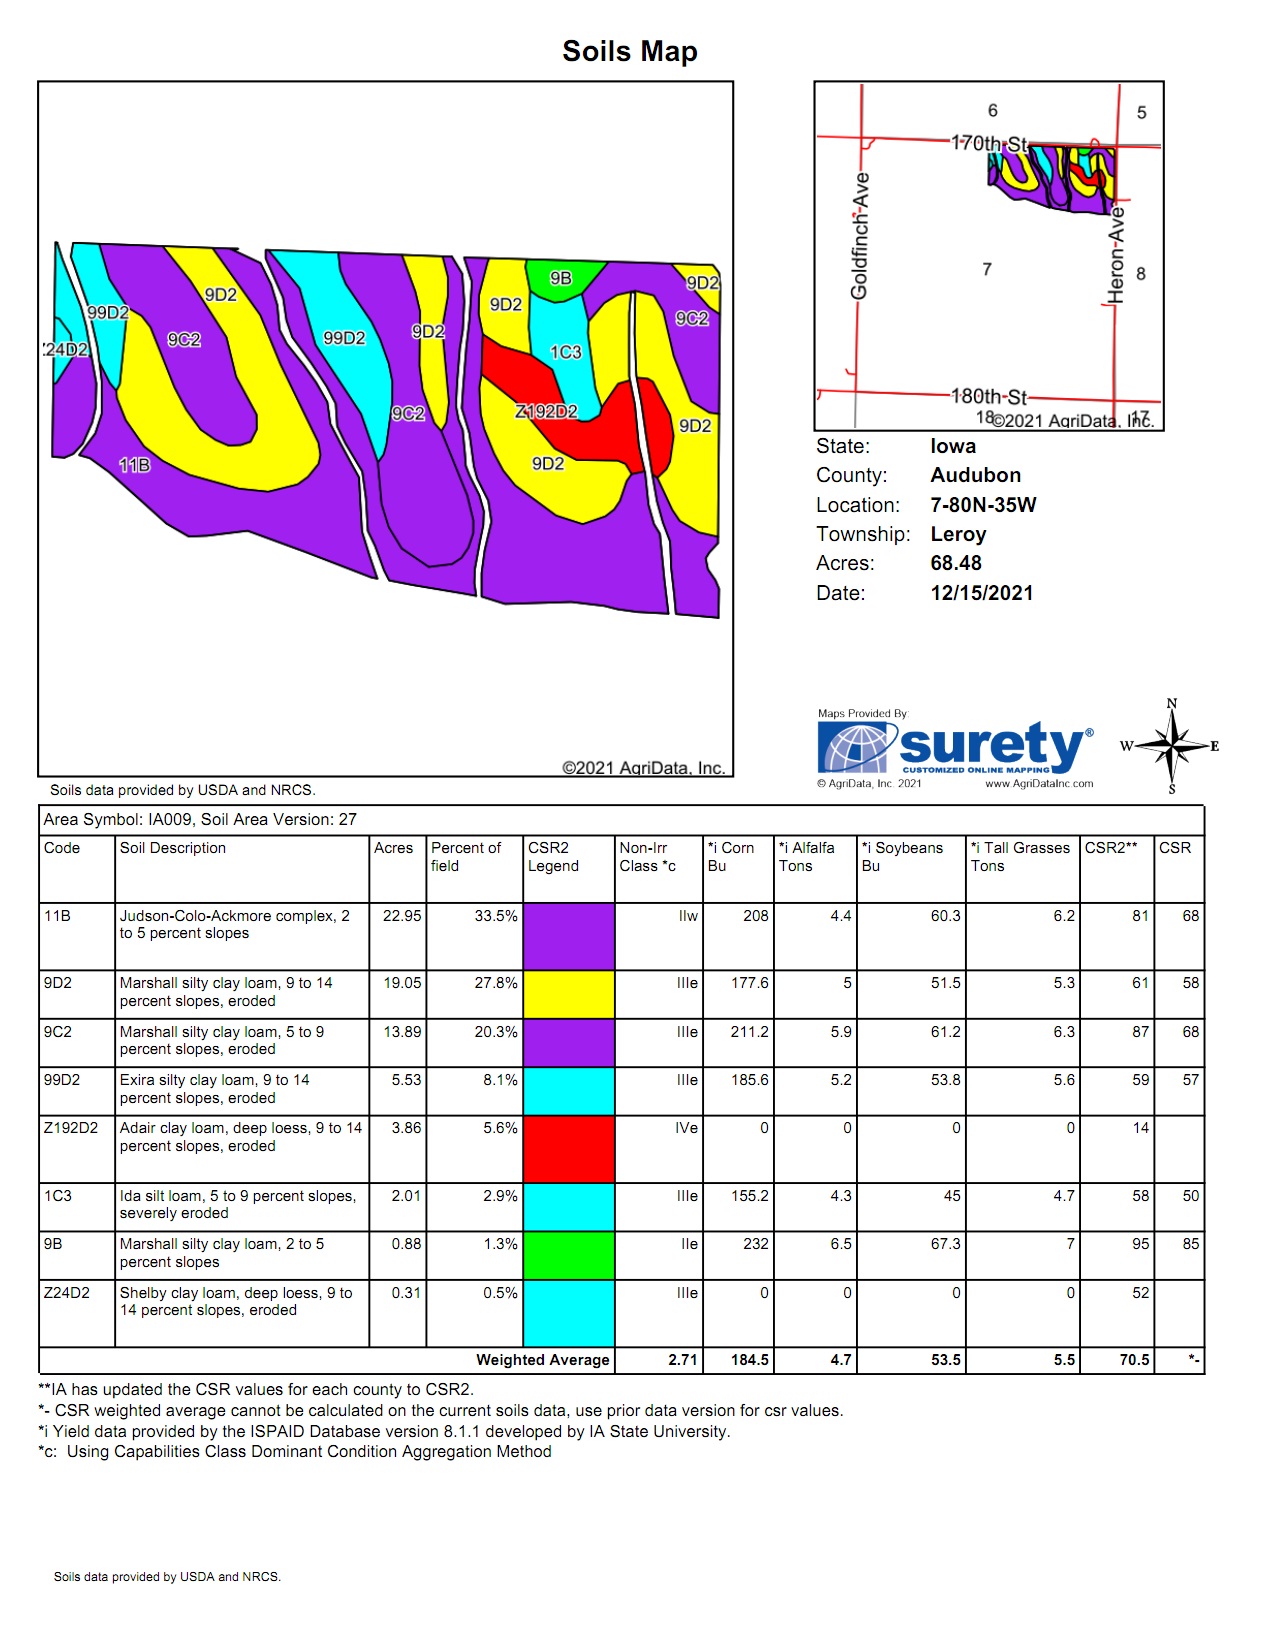
Iowa CSR/CSR2
The Iowa Corn Suitability Rating (CSR) originally developed in 1971 is an index procedure to rate each different kind of soil for its potential ability to produce corn. The CSR Rating is intended to measure one soil’s yield potential against another over time. All soils start at 100 and points are deducted for land conditions such as slope, water and climate.
In addition to the CSR/CSR2 values, Iowa soil maps can also display specific potential yield value ratings from the Iowa Soil Properties and Interpretations Database (ISPAID). The yield data is available for the following crops: Corn, Soybeans, Alfalfa, Ky. Blue Grass, and Tall Grasses.
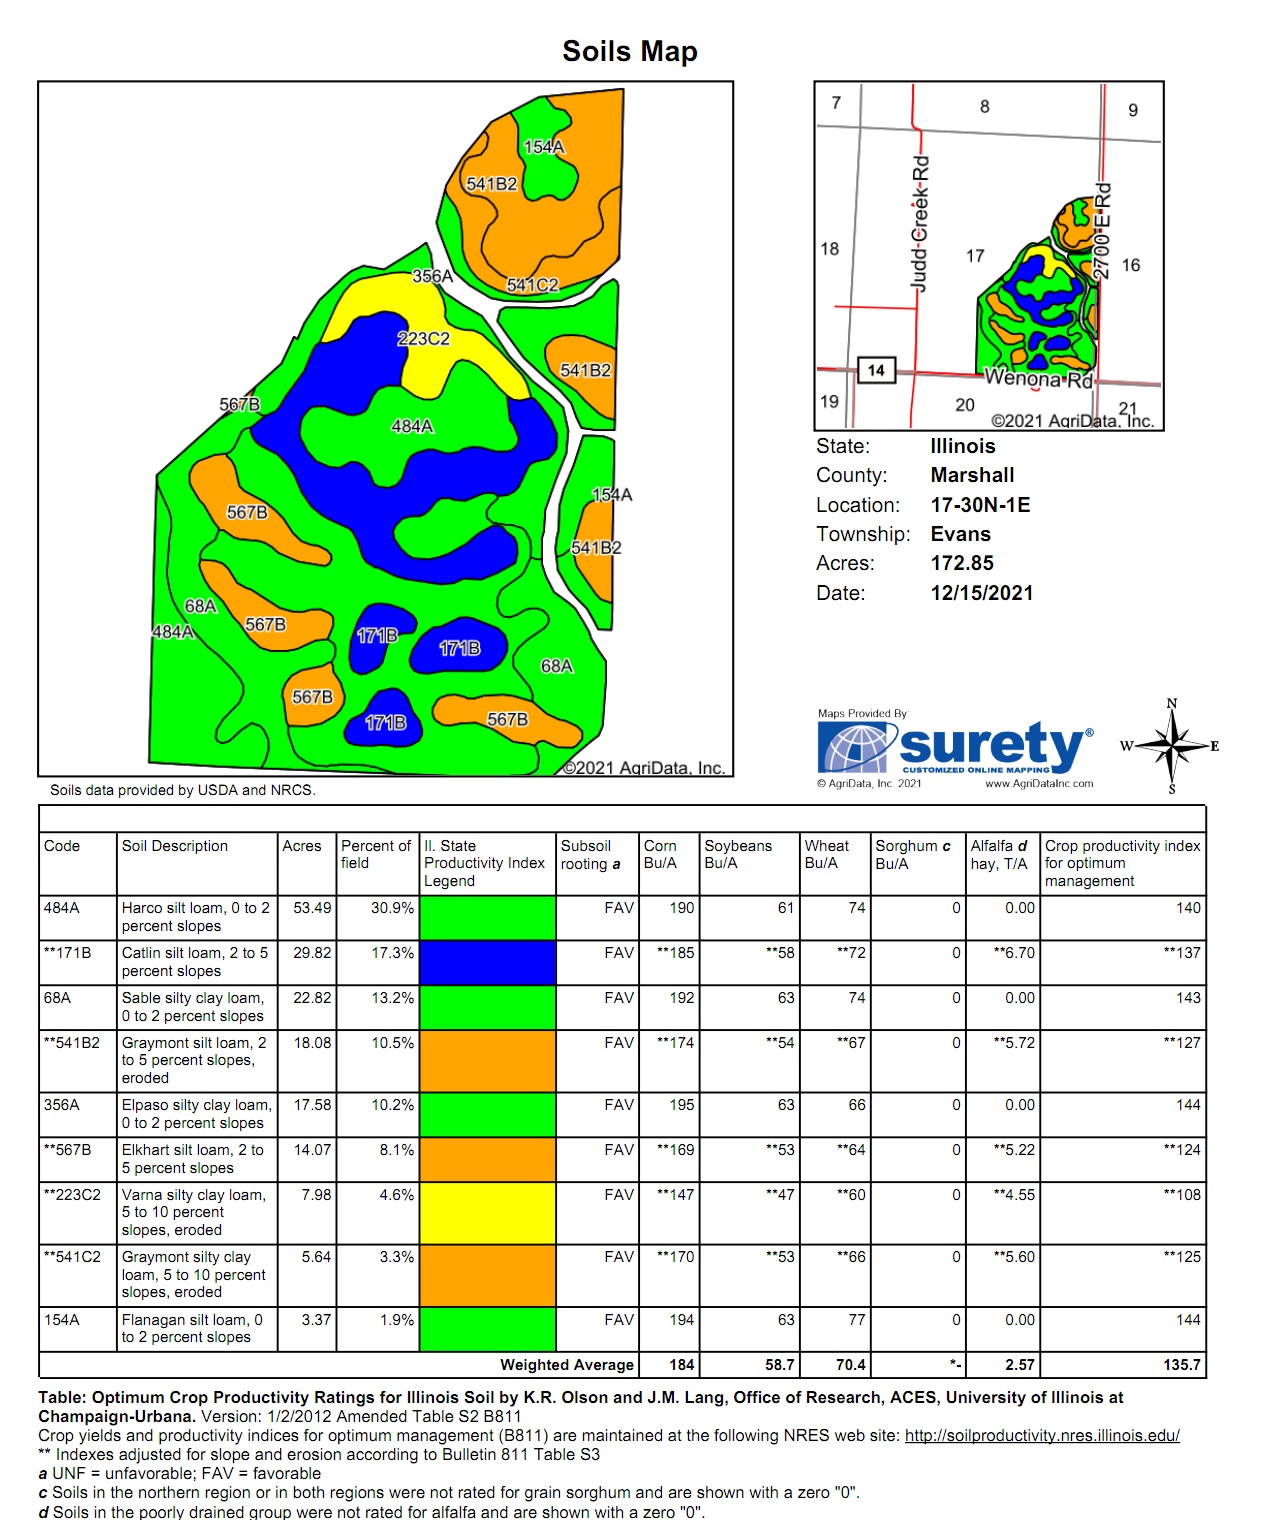
Illinois Bulletin 811
The Bulletin 811 was developed by the University of Illinois to provide crop yields and productivity indices under an optimum level of management. Optimum management criterion was determined by the yields achieved by the top 16% of farmers. The optimum productivity index (PI) can be used to determine the prime agricultural class of any soil type in the state. The rating system determines an A, B, and C class of soil.
Productivity ratings of 133-147 represent Class A, 117-132 represent Class B, and ratings of 100-116 represent class C. Any soil types with a rating between 47-99 are placed in the Other Agricultural Land Class and are not considered prime agricultural land. Bulletin 811 data initially was collected and presented in the year 2000 but has been revised and updated in 2012.
More information on the Bulletin 811:
https://soilproductivity.nres.illinois.edu/
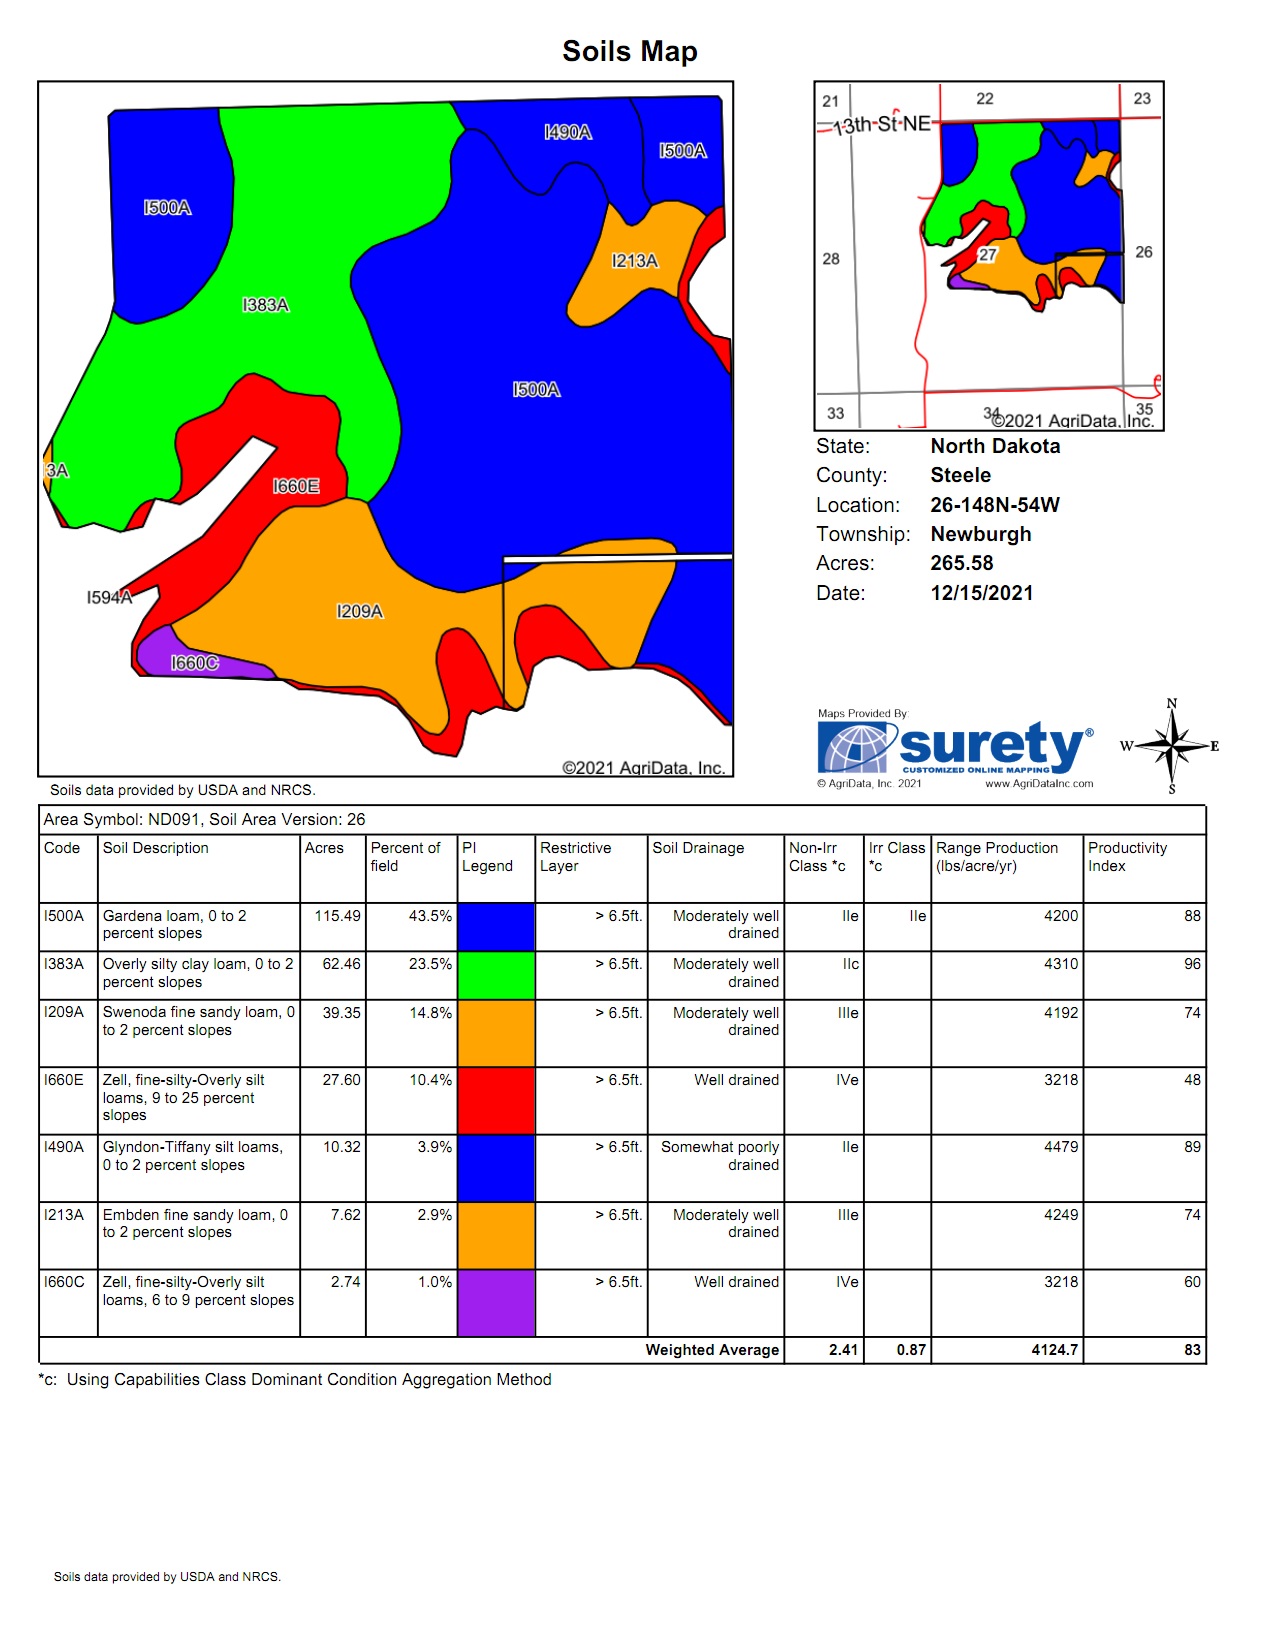
Productivity Index (PI)
The PI is exclusively available in North Dakota, South Dakota, and Minnesota. The NRCS productivity index (PI) model is a derived measure of soil productivity that gives a productivity value to the soil on a 0(worst)-100(best) rating scale. The Productivity Index model assumes that crop yield is a function of root development, which in turn is controlled by the soil environment.
There are 5 assumptions made when the soils are given a rating. (Soil Survey Staff)
- Adequate management
- Natural weather conditions (no irrigation)
- Artificial drainage where required
- No frequent flooding on lower lying soils
- No land leveling or terracing.
The advantage of a Productivity index is while Crop Yield averages will increase over time, index ratings will remain consistent in relation to one another. It is worth mentioning that these PI ratings are not interchangeable between ND, SD, and MN, state lines due to the fact that each value takes into account its surrounding area of values.
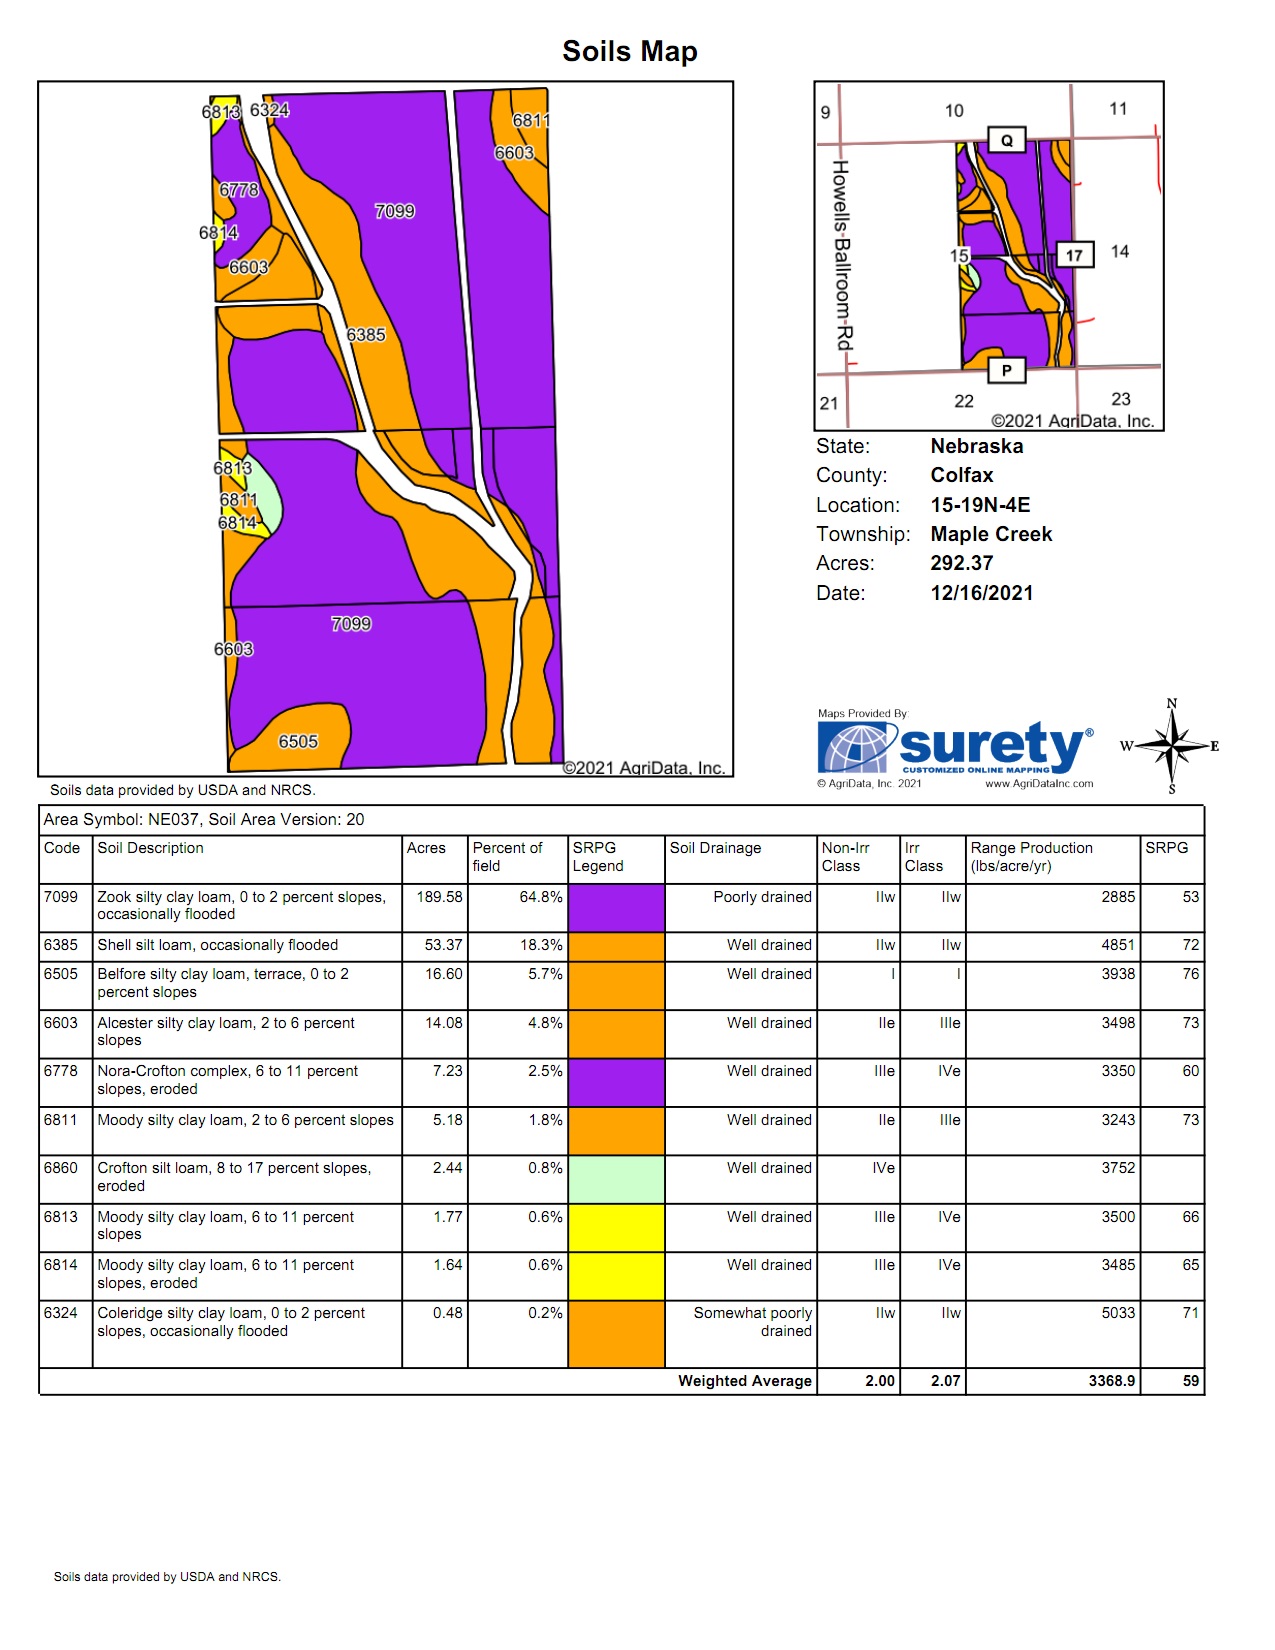
Nebraska Soil Rating for Plant Growth (SRPG)
Previously, soils maps in Nebraska used the SRPG Rating, which was developed by USDA-NRCS staff members to rate soils suitability for plant growth at the county level. SRPG is based on twenty-five soil properties and landscape features. The system rates the major soil characteristics (physical, chemical, and biological) that are important for crop growth. SRPG is no longer supported or being updated by the Nebraska NRCS. It is recommended to use the NCCPI rating.
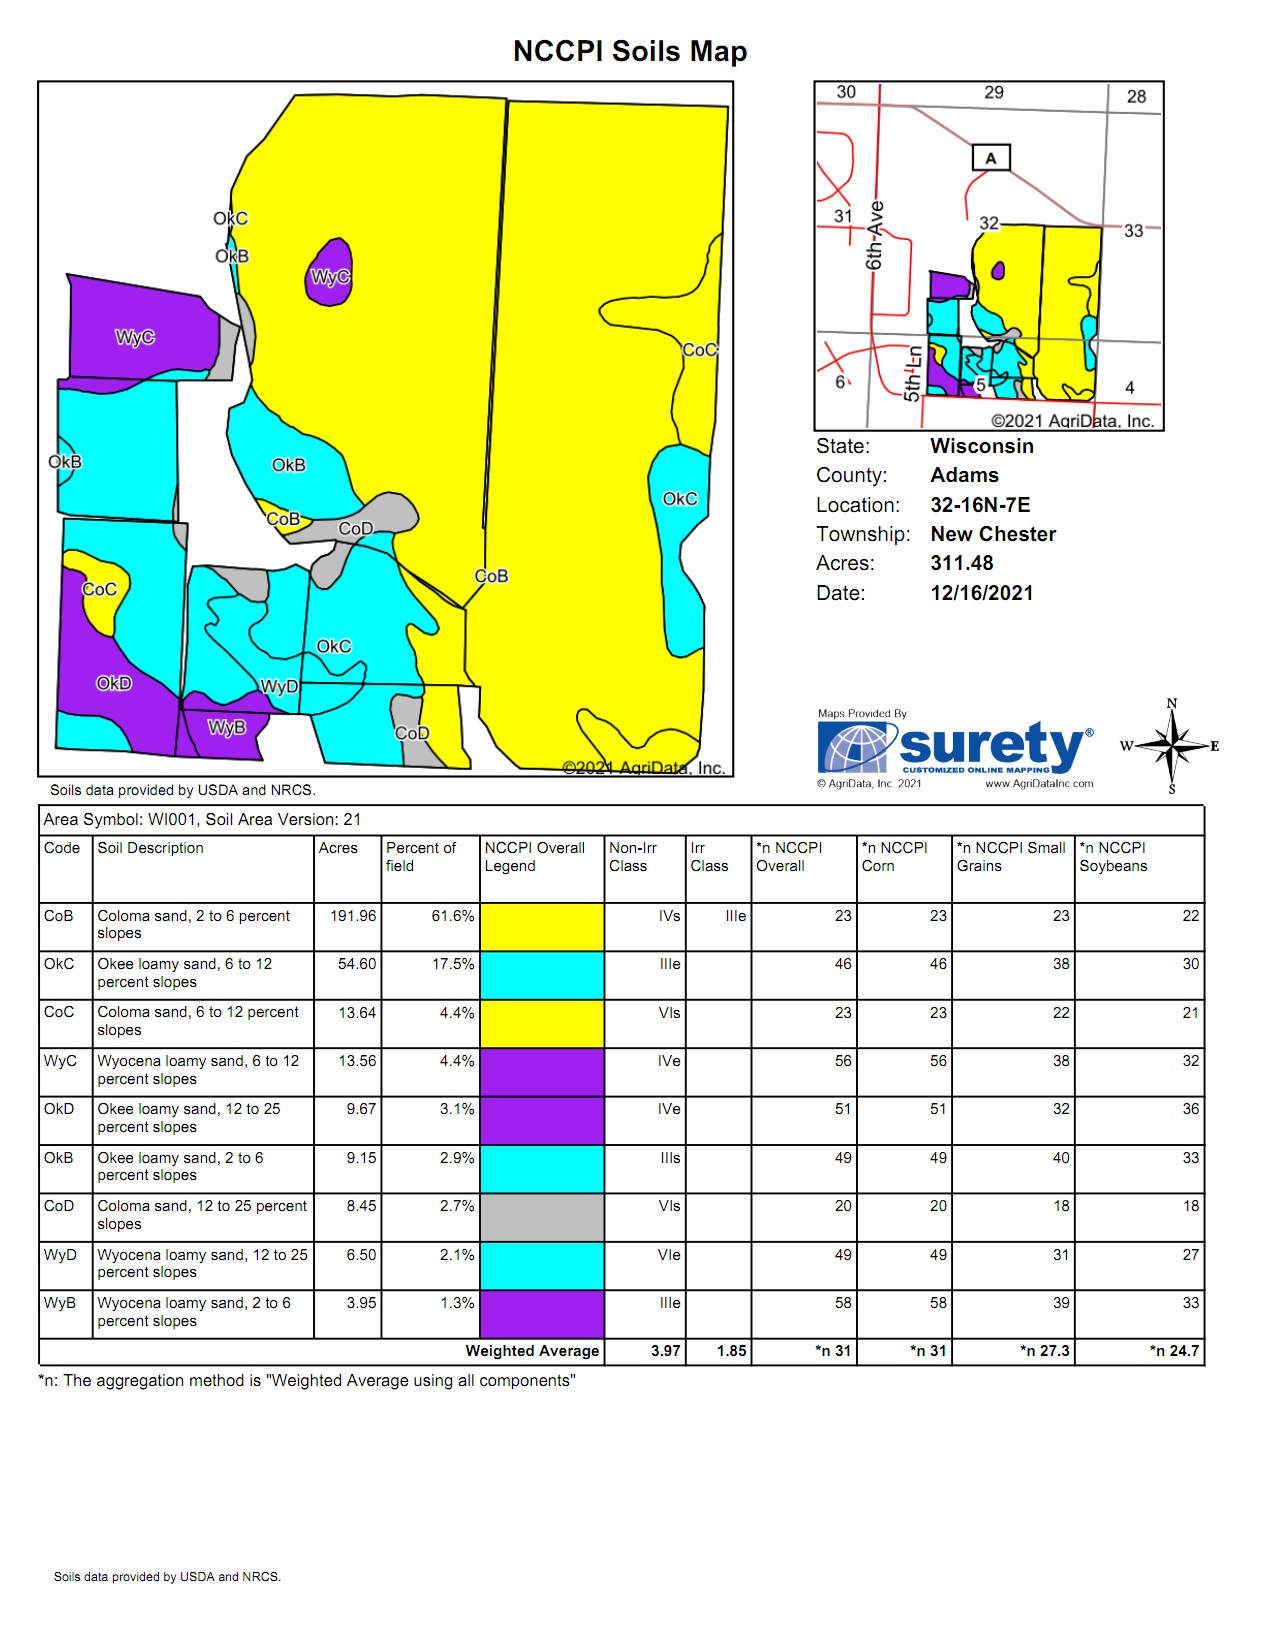
National Commodity Crop Productivity Index (NCCPI)
The National Commodity Crop Productivity Index is a national soil productivity model that is intended to be applied across state lines. The different factors that determine the NCCPI rating consist of the soil, landscape, and climate. This rating system is currently only applied to non-irrigated/ dryland agriculture. The NRCS stresses that this is not intended to replace any current state-specific productivity rating system. However, the NE NRCS has advised to use the NCCPI in place of the outdated NE SRPG.
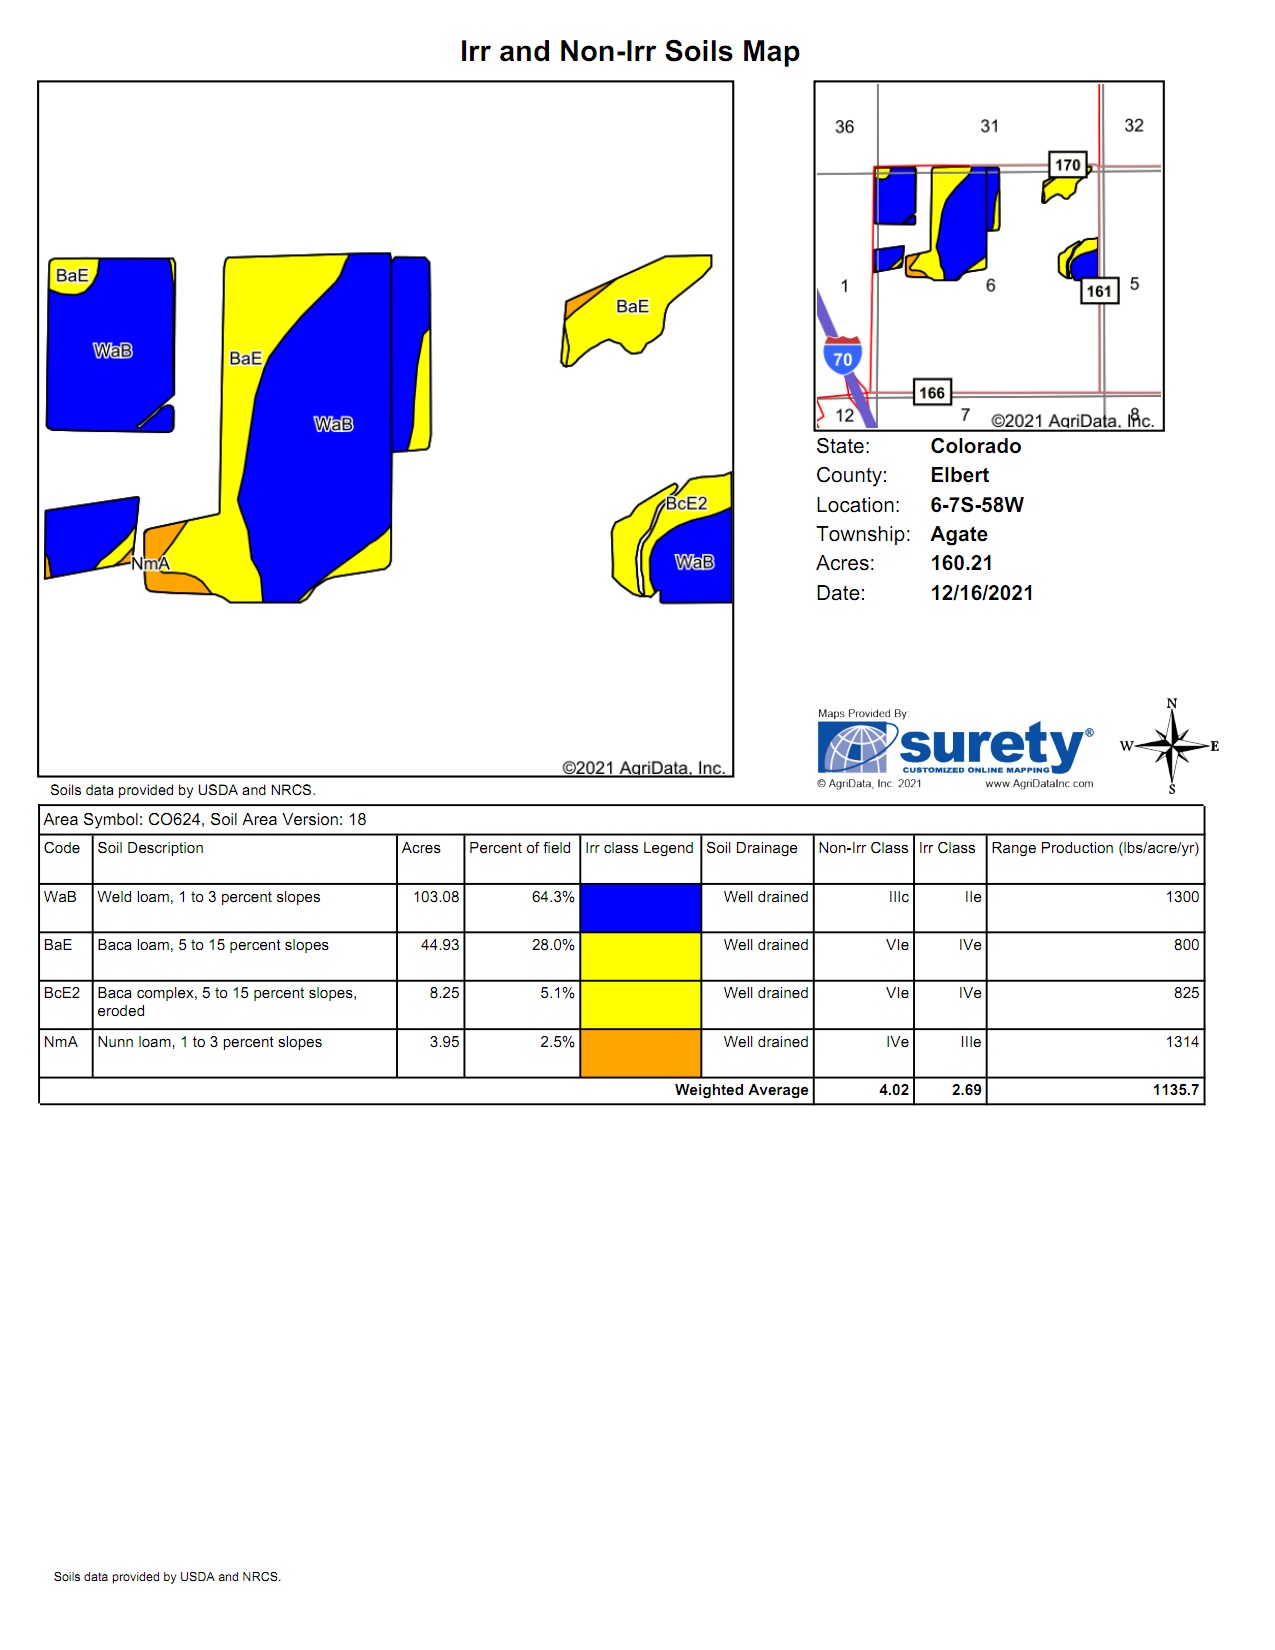
Irrigated and Non-Irrigated Class and Subclass
Land capability classification is a system of grouping soils primarily on the basis of their capability to produce common cultivated crops and pasture plants without deteriorating over a long period of time. This system is broken down into 3 levels: Capability Class, Subclass, and Unit. Surety® Soil maps display the capability class and the subclass.
Capability Class is designated by a progressive numbering system. The higher the number the greater the limitations are and the narrower the choices for particular use.
- Classes 1-4 (I – IV) offer the least number of limitations and are better suited for producing crops.
- Classes 5-8 (V-VIII) typically contain severe limitations and are generally designated for pasture, range land, or wildlife habitat.
- Classes 9-12 (IX-XII) While the NRCS only reports up to 8 classes, there are actually 12 classes in total. Classes 9-12 are mostly comprised of Granite and such and are mostly useful information to engineers.
Capability Subclass are soil groups within each class that define that soils main limitation. These subgroups are defined by the addition of a small letter (e, w, s, or c) to the class numeral.
- “e” indicates the main hazard is the risk of erosion unless plant cover is maintained.
- “w” indicates the hazard is water in or on the soil (potentially corrected by artificial drainage)
- “s” indicates the main limitation is shallow, drought, or stony soil.
- “c” indicates the major limitation is a climate that is very cold or very dry.
Note that Class 1 soils are thought to contain few if any limitations and thus do not include a subclass.
Class 5 soils can only have “w, “s”, or “c” subclass because class 5 soils are subject to little or no erosion. Class 5 soils do have other limitations that restrict their use to pasture, rangeland forestland, or wildlife habitat.
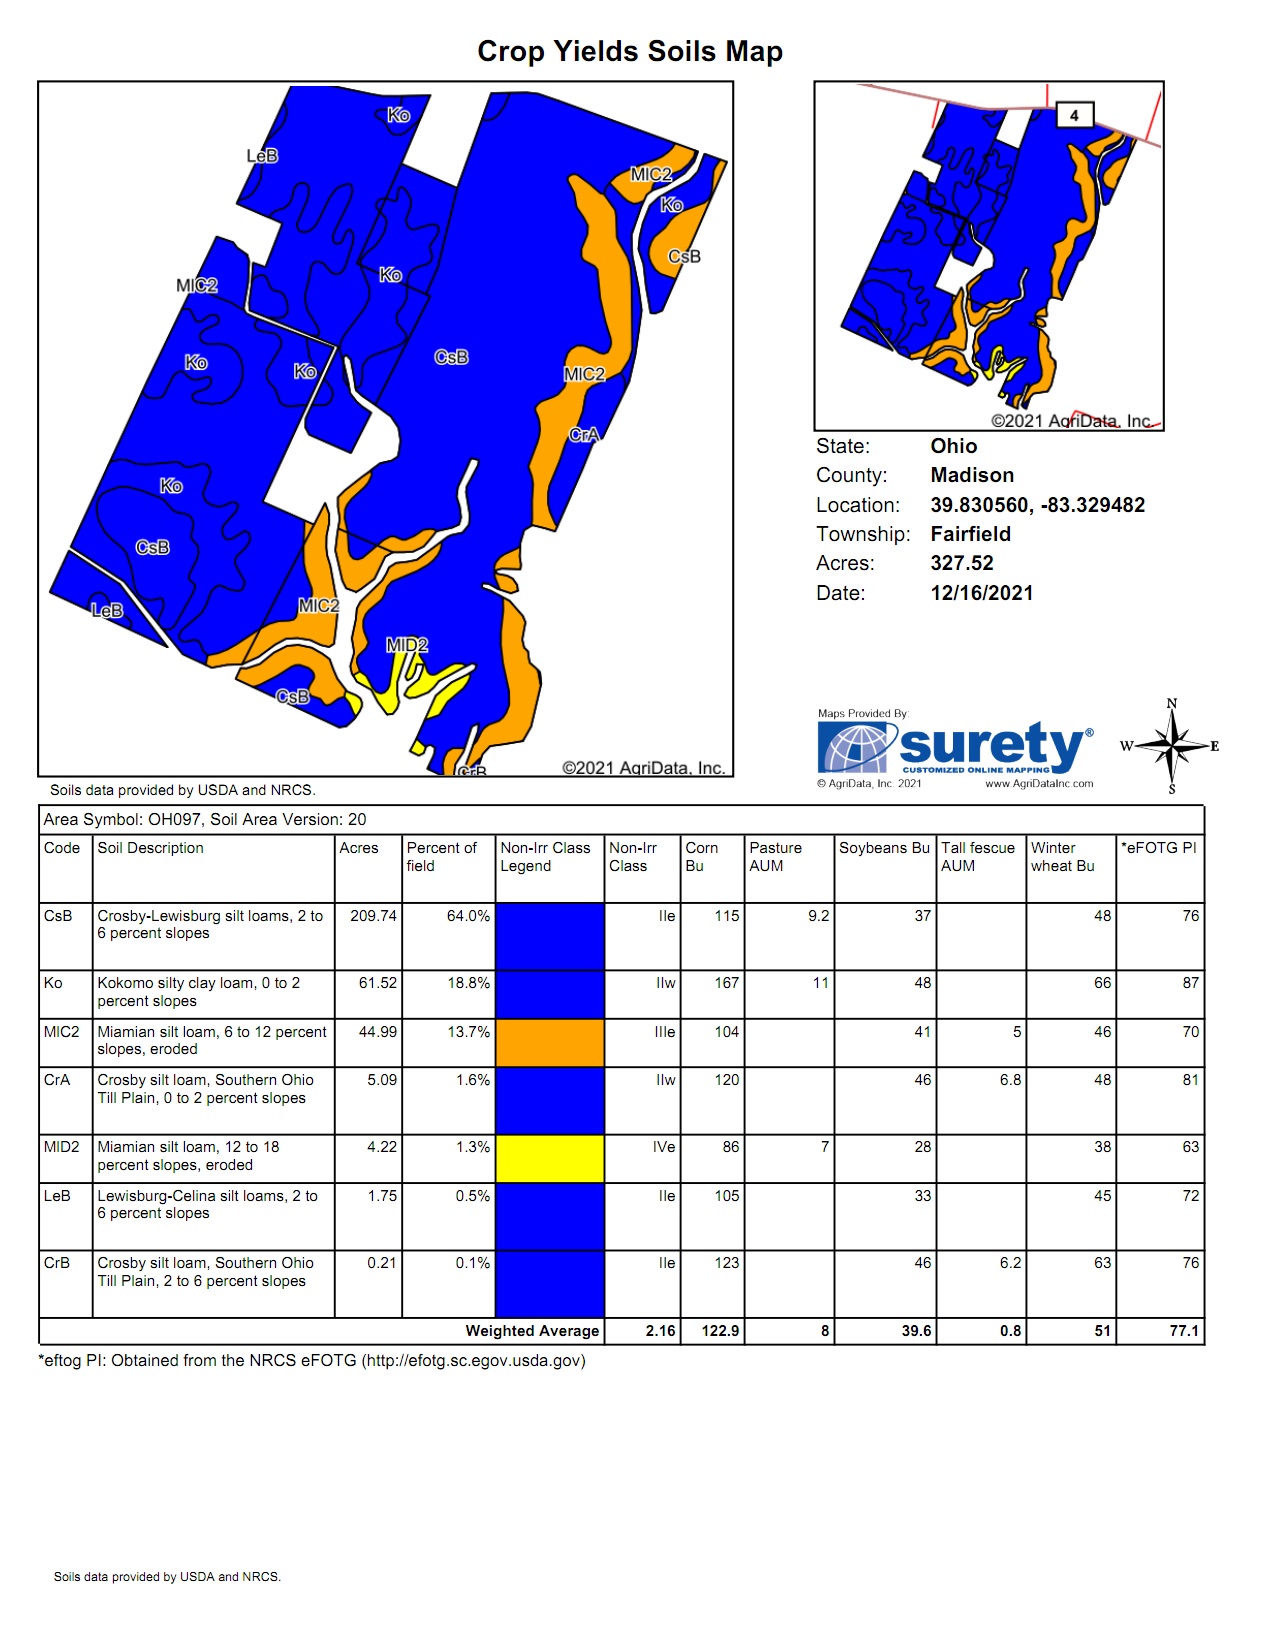
Crop Yield Ratings
Crop yield ratings from the Natural Resources Conservation Service (NRCS) provide a relative ranking of soils based on their potential for intensive crop production. An index can be used to rate the potential yield of one soil against that of another over a period of time. Surety's® Soils Map allows you the option to customize, which crop types you wish to include in your reports.
Note that with the rapid advancement of farming technology, the NRCS has determined that it is no longer possible to maintain Crop Yield values at a national level for each soil type and thus will be removing them from the database over time. However, there are certain state databases that will still include this data.
Additional Soil Features
Soil Features contain properties and other information about the soils that are not exclusive to the productivity of the soil.
This information includes:
- Water Table Depth
- Restrictive Layer
- Septic Limits
- Foundation Limits
- Drainage Class
- Hydric Ratings
- Range Production
- Soil Feature icons
Try out our famous Soil Maps for yourself by creating a FREE 7-Day Trial Account today!